Each experiment will have a reporting page which you will see when you click on the experiment.
Experiment Summary
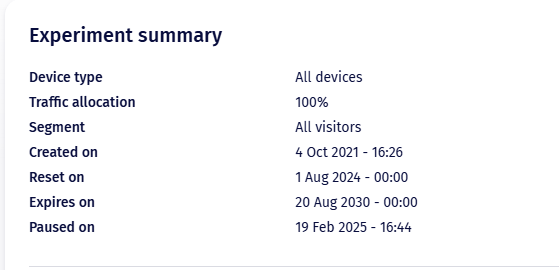
The first section you will see is the experiment summary, where you will find details about how the experiment was setup.
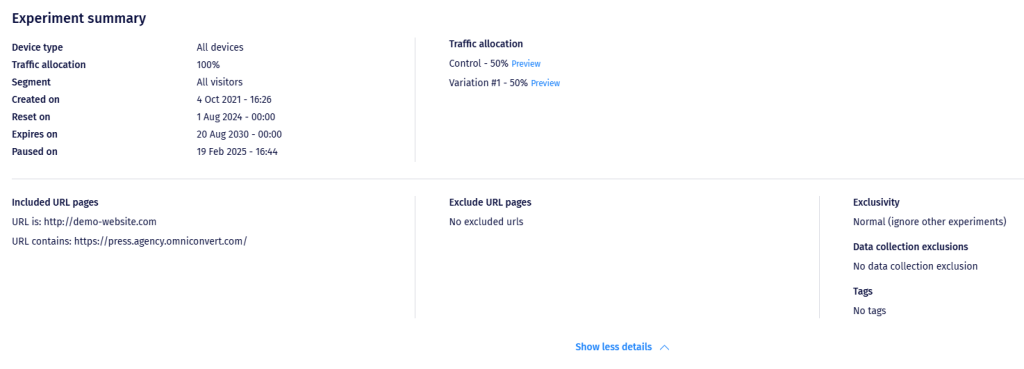
The first portion you see here will contain details such as:
- Device Type – what devices are eligible for the experiment
- Traffic allocation – how much of your total traffic you are allocating to the experiment
- Segment – which group of visitors are eligible for the experiment
- Created on – when the experiment was created
- Reset on – the last time the data has been reset
- Expires on – when the experiment ended
- Paused on – the last time the experiment was Paused
Next, you will see the Traffic allocation for each Variation, you can also see a Preview of the Variations by pressing on the Preview buttons.

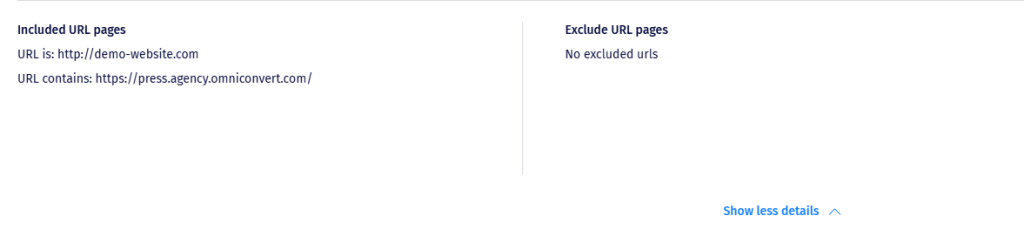
Under these, you will find information about the Audience of the experiment, the pages that you allowed the experiment to run on, and the pages you specifically marked to be excluded.
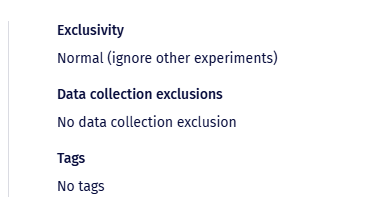
The last portion contains details about:
- Exclusivity – shows if the experiment is set to run alone, or to allow other experiments to run simultaneously
- Data collection exclusions – the IP addresses that you added to be excluded from being registered as data
- Tags – the custom tags you’ve added to the experiment
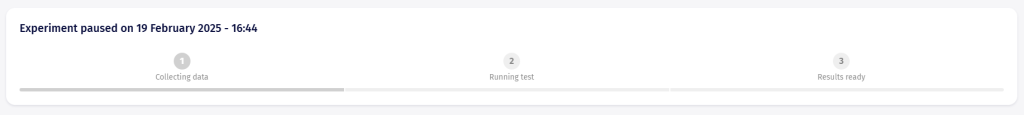
Sample Size Calculator
The next section is the Sample Size Calculator, which will tell you for how much longer the experiment needs to run before it reaches statistical relevance.
You can find more details about this tool here.
Performance
In the Performance section, you will see the results for the goals that you are tracking (default goals and goals that you have implemented) and you can filter the results by conversions. This means that you can see how did the users who converted on a certain goal also converted on the other goals.
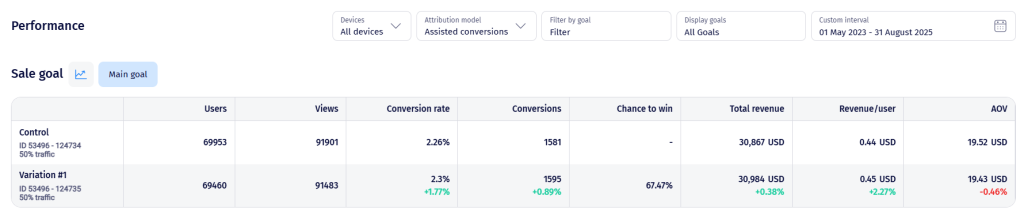
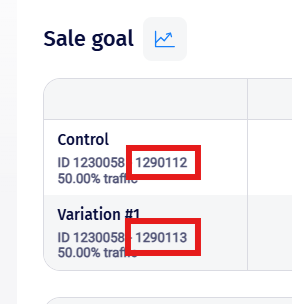
The first portion will contain the Main Goal, which usually is the Sale goal.
On the left side, you will see the Control and Variations, alongside the Experiment ID and Variation ID for each of them.
The first number is the Experiment ID:
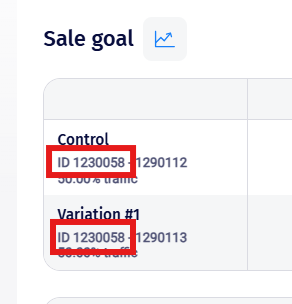
And the right number will be the Variation ID
In order to interpret the data, we must first understand what each column means.
The first column will always be for the Control and Variations, as for the others:
- Users – number of unique visitors who saw the experiment.
- Views – total amount of times the variation/control was seen by the users included in this experiment.
- Conversion rate – shows the percentage of users that converted, which in this case is the number of conversions divided by the number of users x 100.
- Conversions – shows the number of visitors who reached that goal.
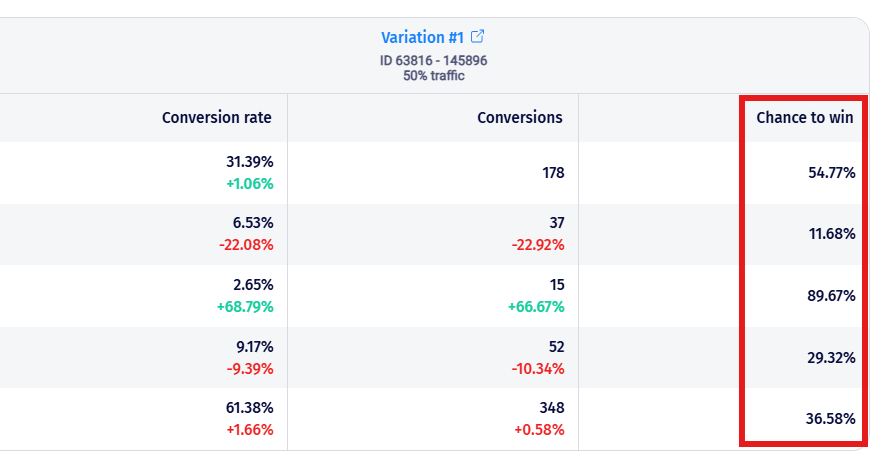
- Chance to win – or Statistical relevance; it shows how much, in percentage, of a chance to win has the variation over Control.
- Total revenue – shows the total amount of money received from the users that have been influenced/included in the experiment and reached the thank you page where the Sale goal was implemented.
- Revenue/user – shows the value of a user, which in this case is calculated by dividing the total amount (Revenue) by the number of users.
- AOV – or Average goal value; it shows the average amount of money that the experiment brought in.
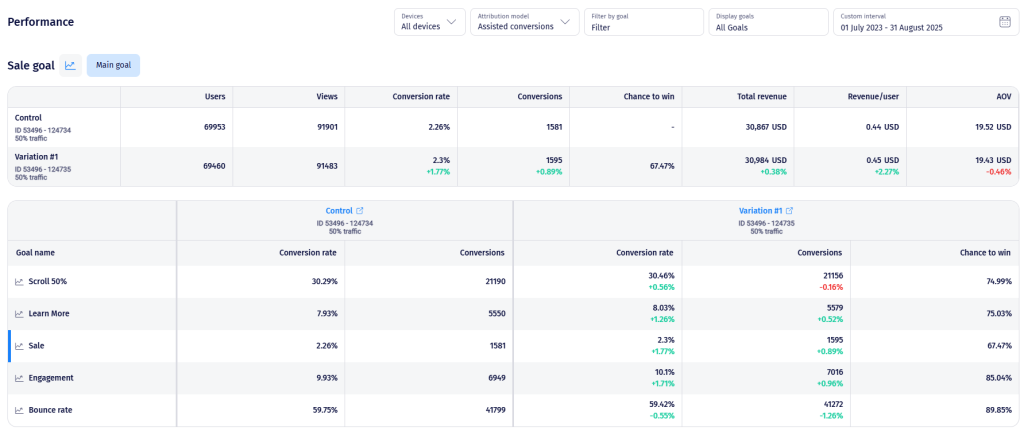
The next portion will be all of your goals for the experiment, and all of the data related to them.
Pressing on the name of a variation will open a Preview of it.
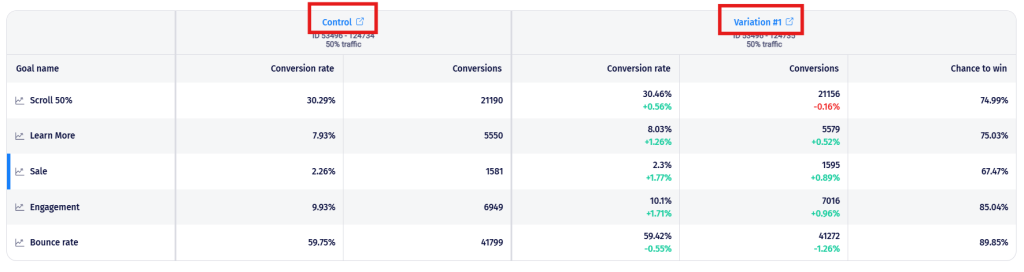
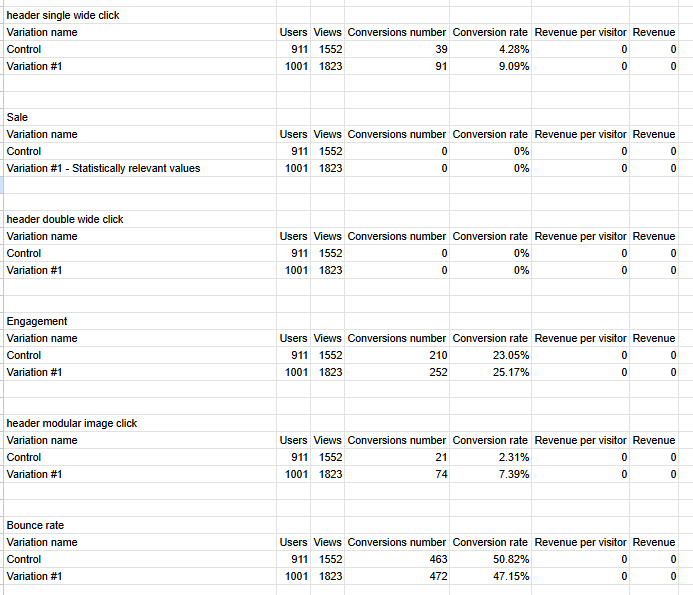
As you can, all of the goals will be listed on the left column, while the next columns will contain the Conversion Rate and the Conversions amount for Control and the variations.
Mathematically, the conversion rate is represented by a binomial random variable, which is a fancy way of saying that it can have two possible values: conversion or non-conversion.
Let’s take an example for a better understanding:

As you can see in the example, the Conversion Rate for the Sale goal was 1.57% on Control, and 2.64% on Variation. This mean for every 1000 Users, 15 made a transaction on Control and 26 made one on Variation.
Let’s call this variable ‘p’.
Our job is to estimate the value of ‘p’ (the conversion rate) and, for that, we do ‘n’ trials (or observe a number of ‘n’ visits to the website). After observing those ‘n’ visits, we calculate how many visits resulted in a conversion. That percentage value is the conversion rate of your website.
Please, keep in mind that every Variation relates to Control. As you can see, the uplift in results is highlighted with green, whilst the decrease with red, and it is shown in percentage relative to the Control version.
The Chance to win shown at the end of the Performance section are the results calculated with the Frequentist and Bayesian algorithms. A good result, which shows that you should implement the modification made within a variation should be above 95% on the main goal.
We have a separate article related to Chance to Win here.
On the left of each goal, you will find a Graph icon.
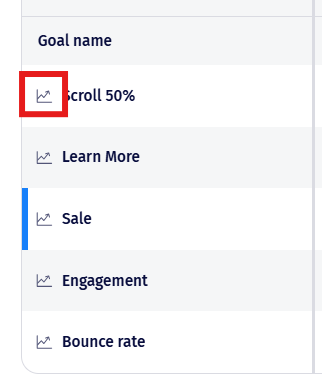
Pressing this will open up a graph that will show you the evolution of the goal.
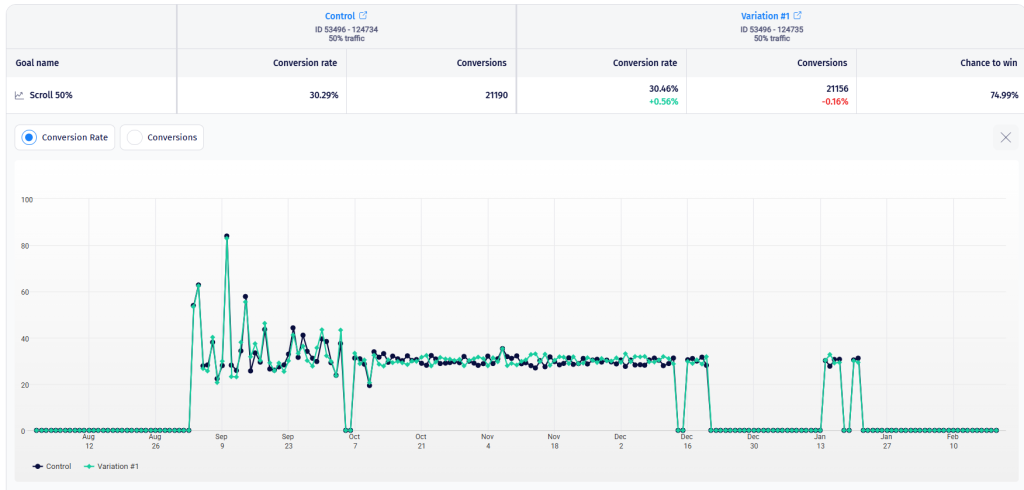
For regular goals, you can select between seeing the graphs for Conversion Rate and Conversions.
Reporting for Surveys
In the reporting page for a survey, you will find the same filters available for your data and the experiment summary, as in any other experiment (see above).
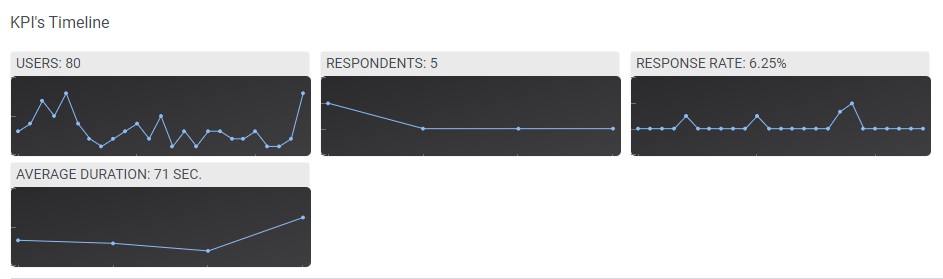
In the KPIs Timeline section, you can see a graphical representation and the value for the total number of visitors who were invited to take the survey, the number of respondents, the response rate (calculated as percentage of respondents from the total number of users) and the average completion time.
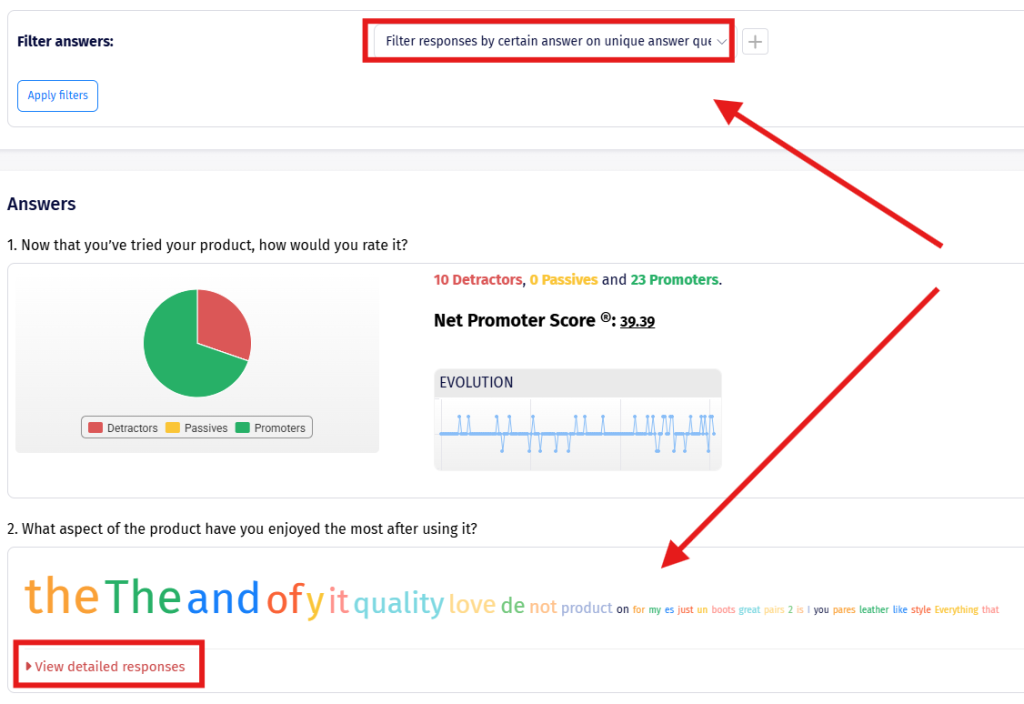
Below, you can see the actual responses that were given to each question in the survey, you can filter the results based on certain answers or unique answer questions:
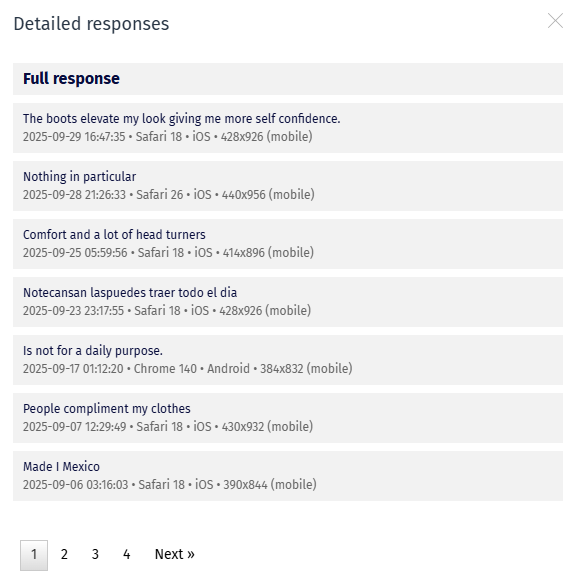
A detailed response contains the exact response written or chosen by the user, the date and time when he submitted that response, the OS and also the device type and screen resolution:
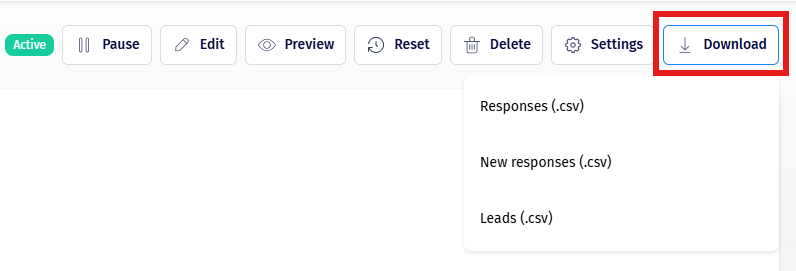
To download a .csv report containing the Responses or the captured Leads, you can use the option at the top of the page:
Filters
Every experiment reporting page will also include multiple filters you can use.
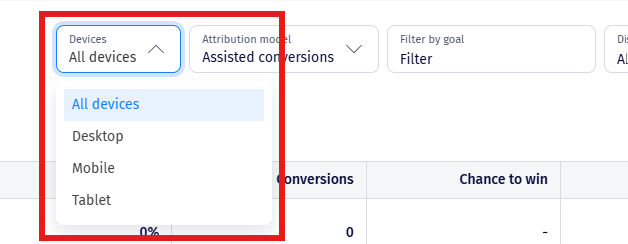
Devices
Since experiments can behave differently from device to device, you can filter the data by the device type.
Attribution model
Allows you to filter the data by the 2 attribution models: linear and assisted.

Linear distribution – each touchpoint in the conversion path – in this case, the A/B test and the Overlay, would share equal credit for the sale (50% each, for the same sale). If the product that was sold is $300 worth, and each experiment would be considered equally responsible for the conversion, $150 would be attributed to the A/B test and $150 to the overlay.
Assisted conversion – when considering the sales we made based on the assisted conversion model, we won’t give 50% of the ‘credit’ to each experiment for succeeding to make the user convert. Each experiment will be equally and fully responsible for the conversion – 100%. Therefore, the $300 sale will be once attributed to the A/B test where the visitor participated, and the sale will also be assigned to the overlay giving 15% discount to the user. In the assisted conversion model, the total amount of sales is a bit less realistic. Given the fact we take into consideration $300 for the A/B test and $300 for the pop-up overlay, that would mean that our actual sale is (cumulatively speaking) $600, which is not the case.
Filter by goal
Allows you to create detailed filters related to specific goals.
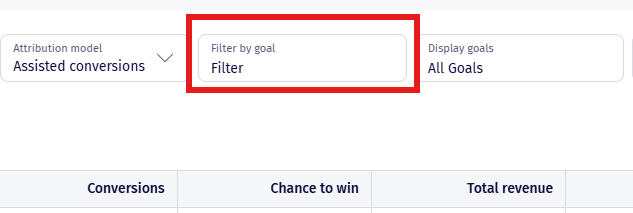
Once you press on it, a new screen will open.
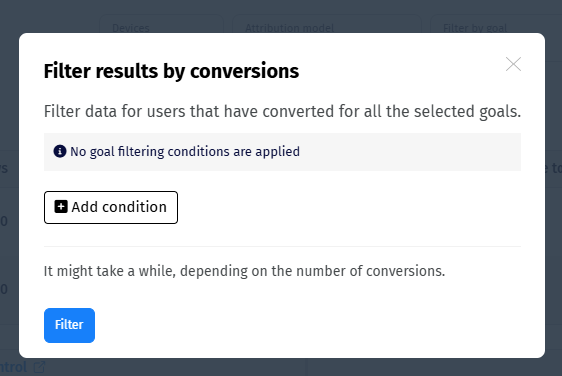
Here you can add multiple conditions and filter by them. Each condition will be related to a specific goal.
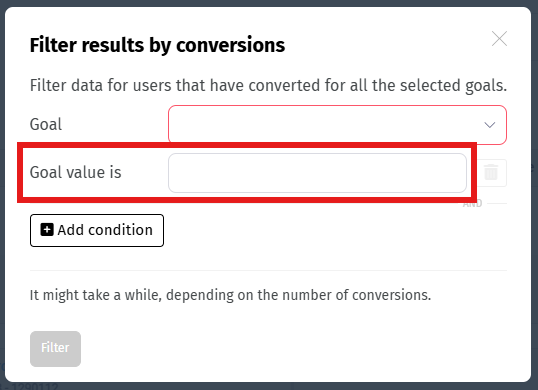
But you can also further your data by showing only specific values for a goal.
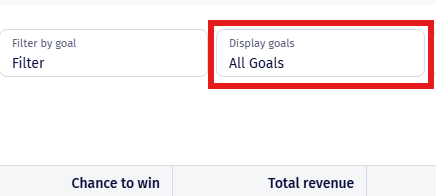
Display goals
Allows you to select which Goals will be displayed in the Performance tab.

Timeframe
Lastly, we have the timeframe. This allows you to decide the days which will be included in the displayed data.
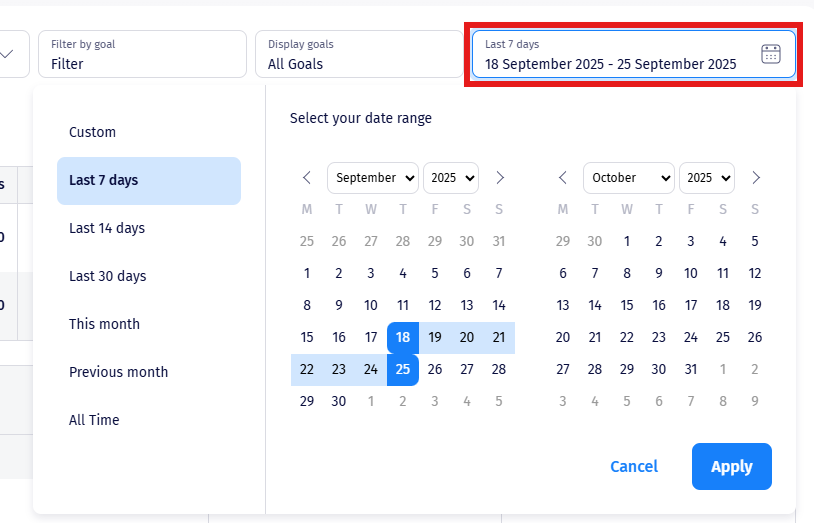
It is very important to ensure that you have the correct timeframe selected for your experiment. This is especially important when comparing the data with the results in analytics tools, such as GA4.
Download CSV
On the top right of the page, you will also see this ‘Download‘ option. This allows you to download a csv containing your data.
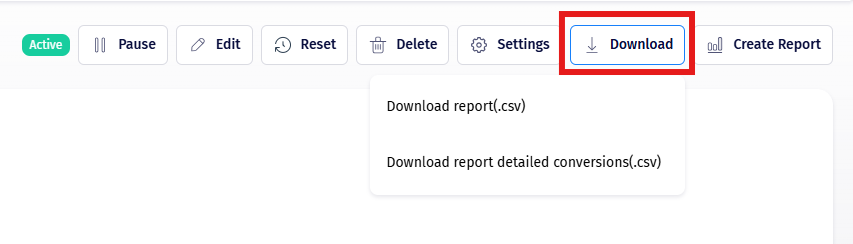
There are 2 types of downloads you can perform:
Download report – will contain the data as seen on the Performance page.
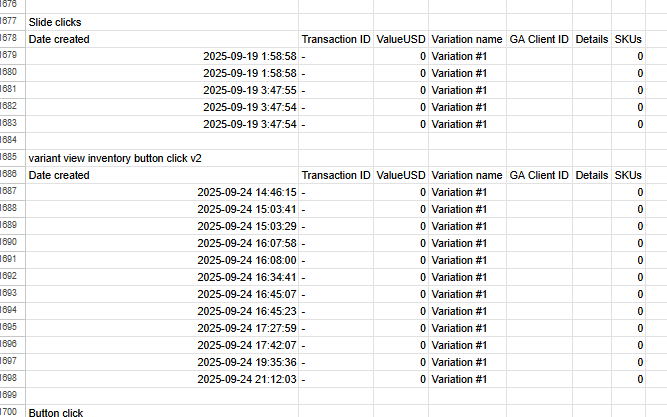
Download report detailed conversions – will include details for the conversions such as the transaction IDs for the Sale goal.
Reports
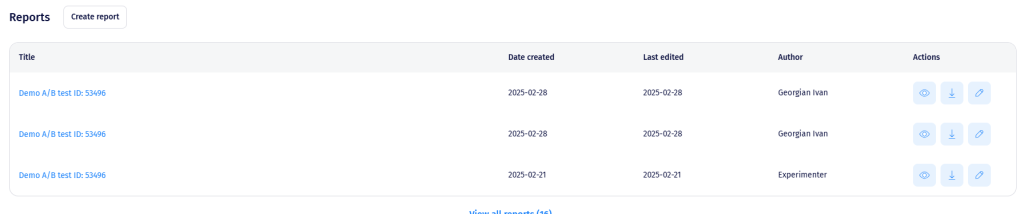
This section allows you to generate a report using the current data in the experiment. You can also download one of the previously generated reports.
Notes
The final section is where you can see any notes added to the experiment by your team, or the recent changes made to the experiment.
This way you can keep track of what modifications were made and by whom.
