Understand the Dashboard
Overview
The Dashboard is the first thing you see when you log into Explore. It gives you an at-a-glance view of how your experiments are performing, built primarily around your Sale goal.
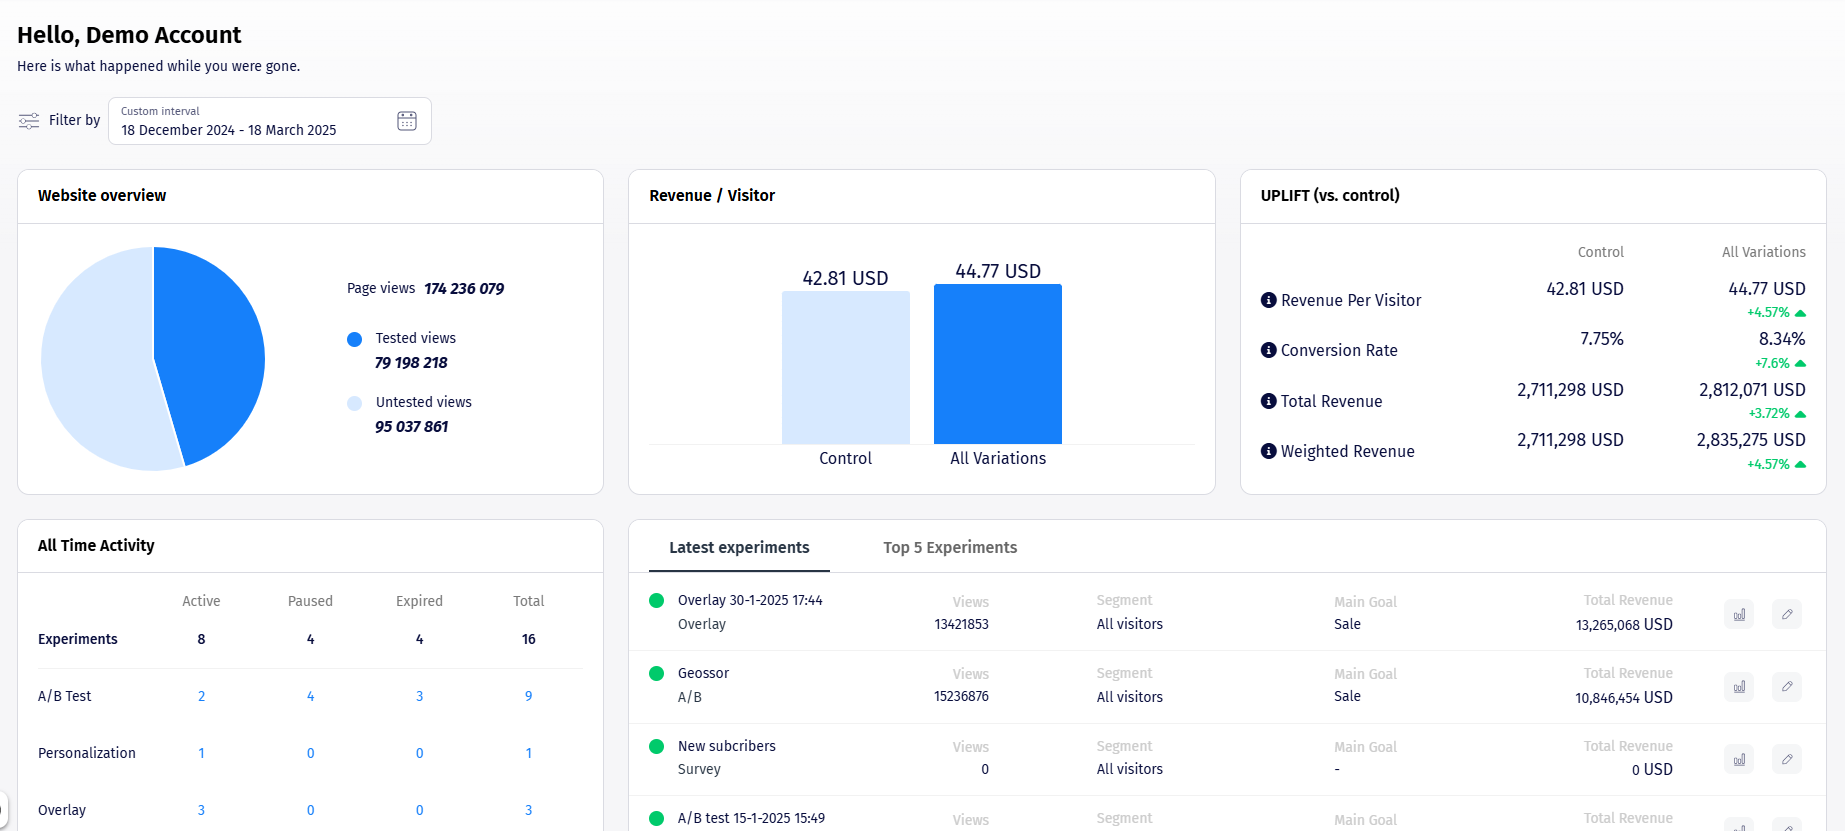
Website overview
Shows page view activity for the selected time period. If you see "No page views yet," it usually means the tracking code isn't installed yet, or hasn't been detected - check Install the Tracking Code on Your Website or Tracking Code Not Detected.
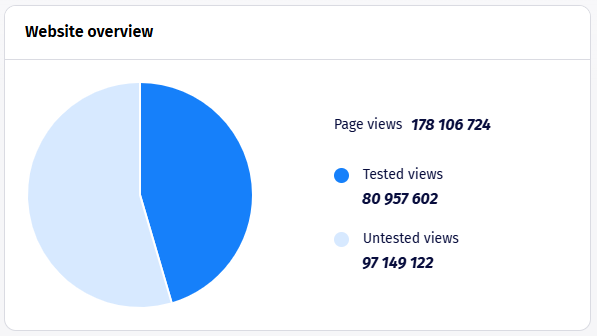
Revenue / Visitor
Compares revenue per visitor between Control and All Variations for the selected period.
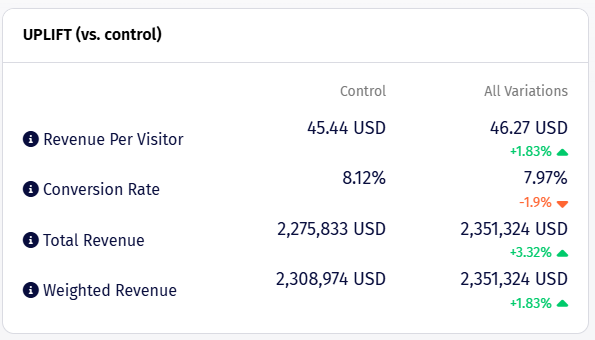
UPLIFT (vs. control)
Compares Control against All Variations across four metrics:
-
Revenue Per Visitor
-
Conversion Rate
-
Total Revenue
-
Weighted Revenue
All Time Activity
A breakdown of every experiment you've ever created, by type (A/B Tests - Web, A/B Tests - Mobile, A/B Tests - Server-Side, Shopify Experiments, Personalization, etc.) and by status (Active, Draft, Paused, Expired).
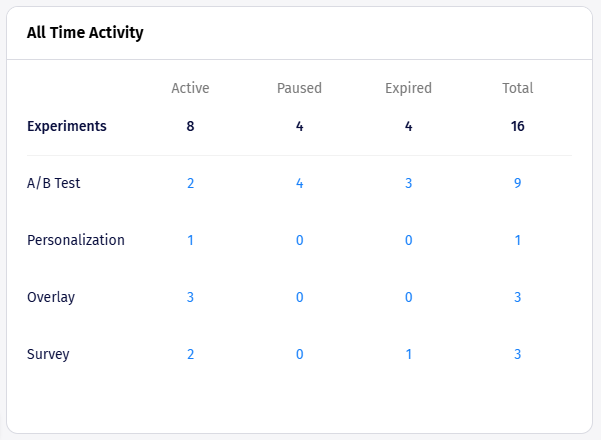
For a full explanation of what each status means, see the Experiment Statuses section in Activate & Manage Experiments.
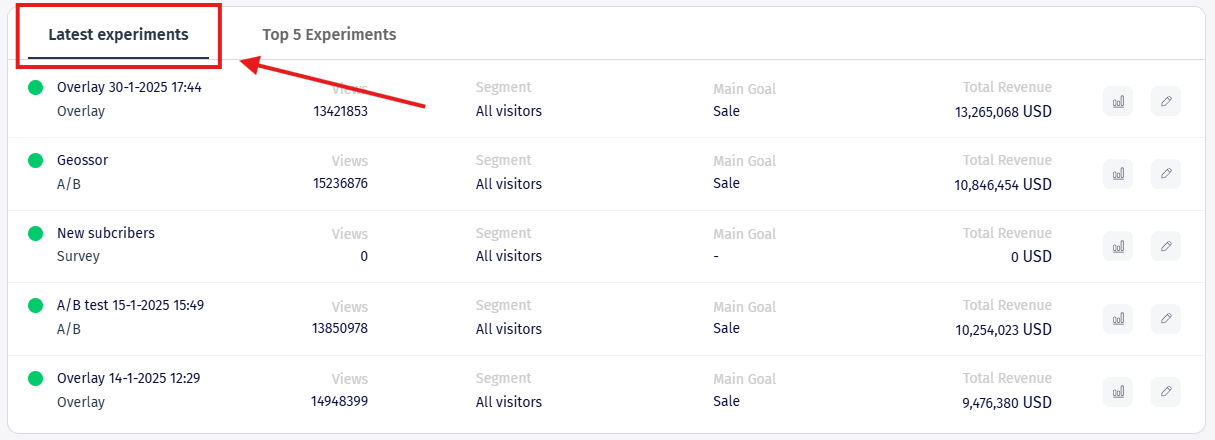
Latest experiments / Top 5 Experiments
Two tabs let you switch between your most recently created experiments and your top 5 performers. Each row shows Views, Segment, Main Goal, and Total Revenue, with quick-access icons to view the report or edit the experiment directly.
Filtering the dashboard
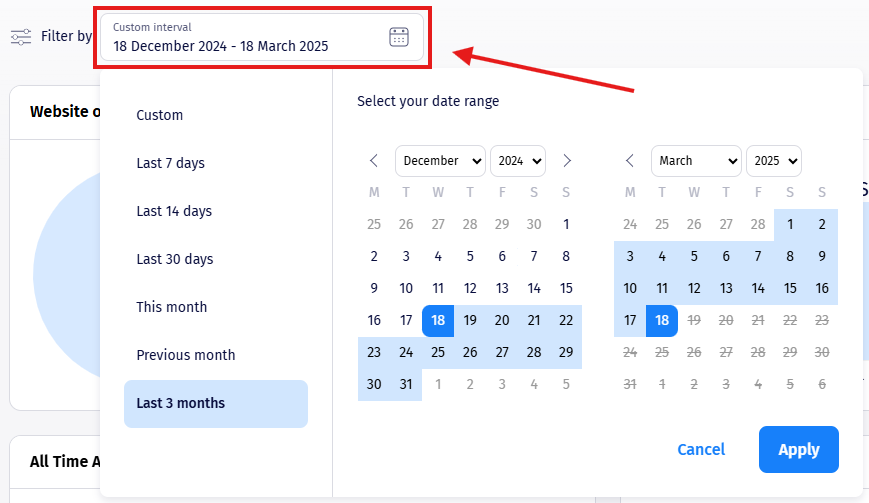
Use the Filter by control at the top to change the date range shown across all panels.