The Explore A/B Editor is an extension for your browser which contains all the useful tools Explore provides for you.
From the Visual Editor, to the Experiment Debugger, to the Omnitool, everything was unified under a single tool which is very simple to use.
You can download it from here.
Visual Editor
Installing the extension will automatically allow you to use the Visual Editor, a very powerful tool which can be accessed when creating your experiments, this is how you can make changes for your Variations without learning code or hire expensive programmers.
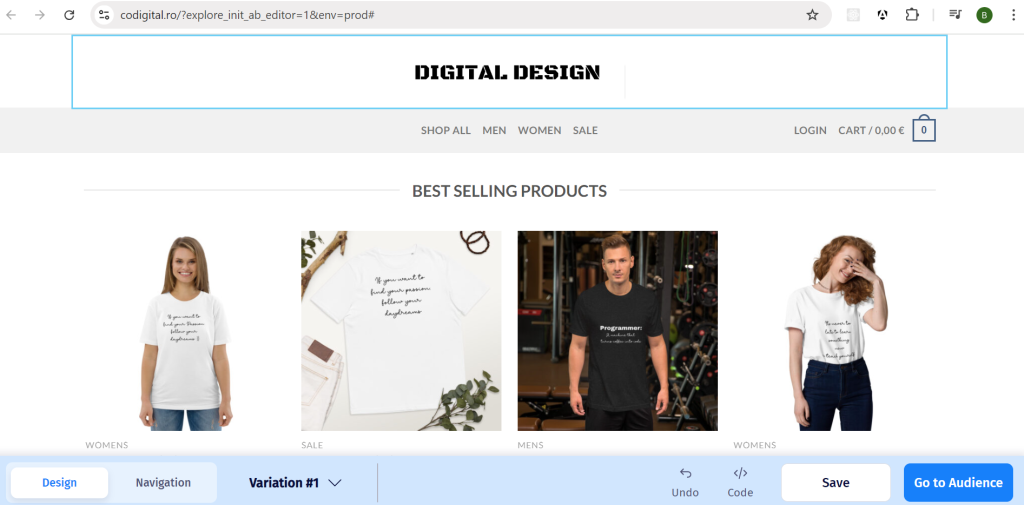
You can learn more about the Visual Editor by following this article.
A/B Test Editor
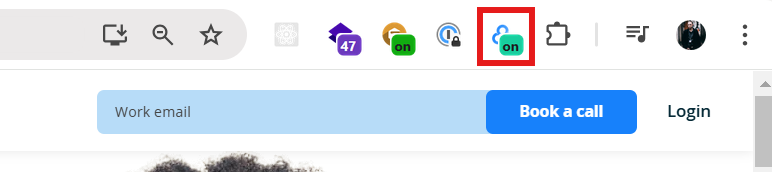
Once you have your extension installed, you will be able to see it by pressing the Extension button.

From here you can also Pin it so it will be always visible on your extension bar.

Now, access the extension either from your pinned extensions tab or by using the Extension icon.
This will open the A/B Test Editor, as you can see, it comes with a lot of useful features, which we will be discussing further.

1. Dashboard
The Dashboard button will take you to your Omniconvert Explore platform dashboard.
2. General
Here we have two options available.
2.1. Bypass cache
This will ensure you always get fresh information. This means you will be able to instantly see changes you apply to your experiments. CDN and internal caches are bypassed.
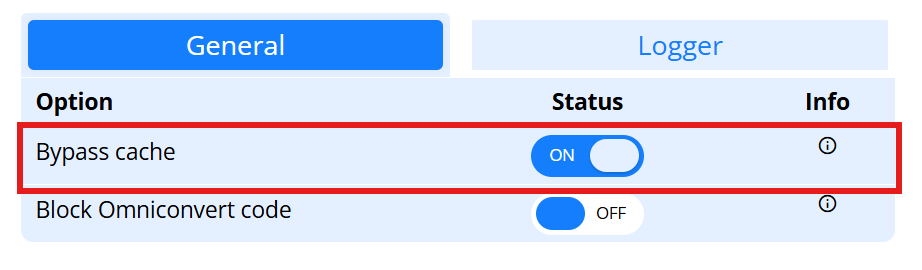
Under regular circumstances, when a change is made to an experiment, it takes around 5 minutes for it to take effect. With this option, the waiting time is no longer a requirement, as the change will be instant.
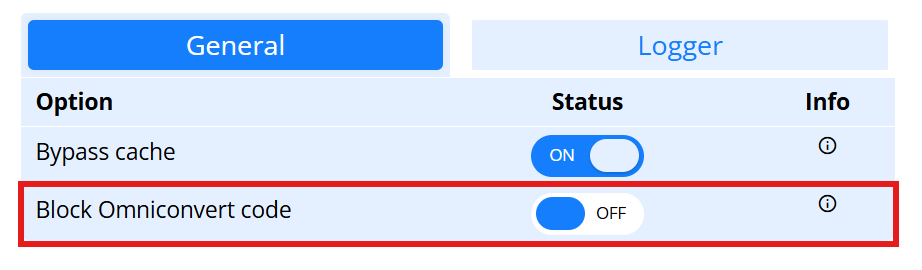
2.2. Block Omniconvert code
Enable to preview how the website would look like and behave without the Omniconvert code. Will block the request for the Omniconvert script.
3. Logger
These are settings for the Logger, this little icon you see by default on the bottom left corner of your screen, which is a minimized version of the tool, allowing insights into the logs and the debugger at quick glance.

We will go into more details regarding the Logger later on.
3.1 Display
Display the Logger in-page, to see what happens at a glance.
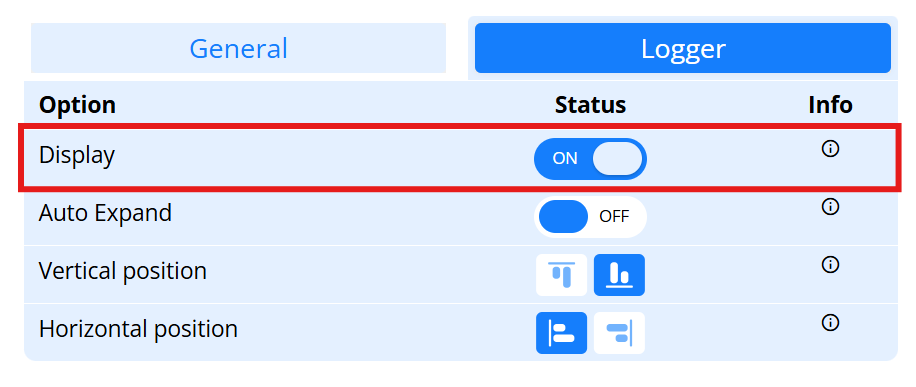
This options allow you to completely hide the Logger if you do not wish to see it. By default it will be visible.
3.2 Auto Expand
Display the Logger expanded when loaded, instead of having to click to have it expanded.

By default this is turned of, meaning that in order to access the Logger screen, you need to press on the icon and this will expand it. Turning this on means that whenever you load the page, the Logger will auto-expand.
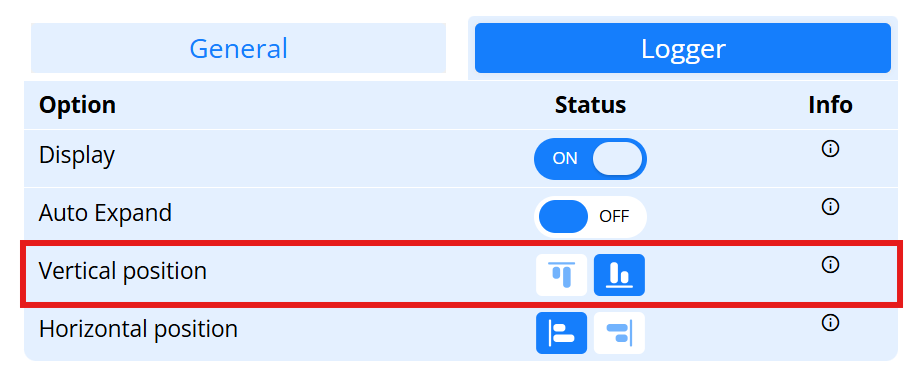
3.3 Vertical position
The logger will be displayed in page either on top or in the bottom.
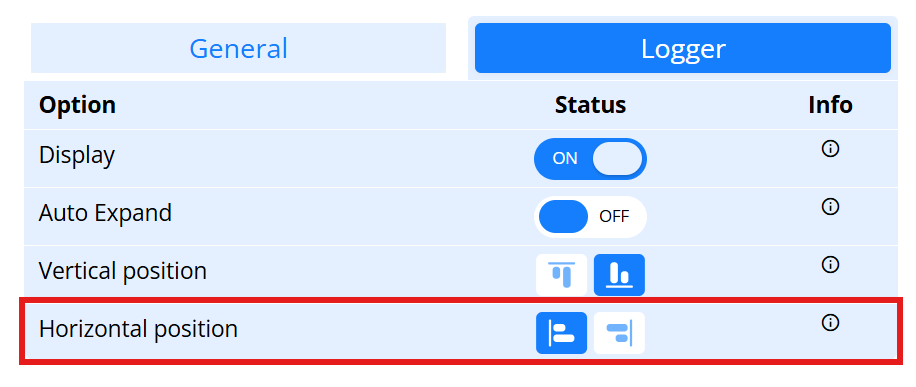
3.4. Horizonal position
The logger will be displayed in page either to the left or to the right.
4. Variation Picker
This allows you to manually pick which variation will be displayer for your experiment. This is an useful alternative if you do not have a 100% Allocation for a Variation and you want to see it without constantly refreshing your session.
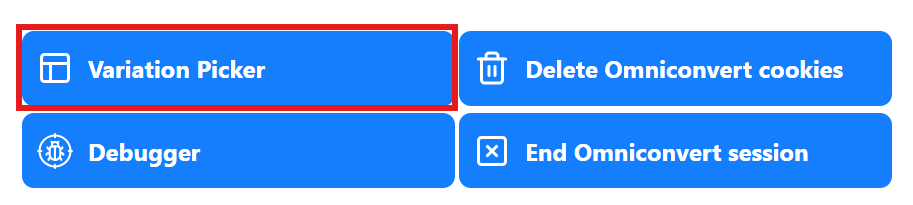
Please bear in mind that this requires a page refresh to apply.
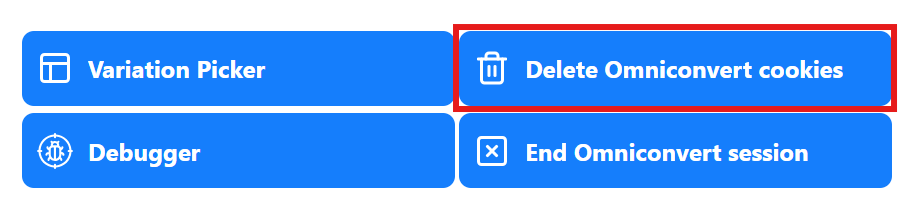
5. Delete Omnicovert cookies
This option will delete all Omniconvert cookies.
6. End Omniconvert session
This option ends current session and will start a new one once the page is refreshed.
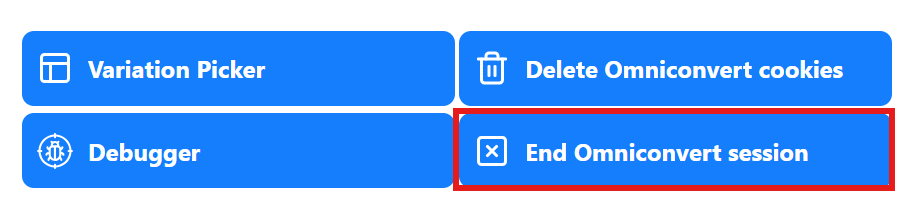
Please bear in mind that this requires a page refresh to apply.
7. Debugger
See applied experiments or reasons for not applying, sent goals, custom attributes and errors, as well as a full log.

The Debugger is a powerful tool which provides a lot of insight regarding your experiments.
Debugger
If you have active experiments are not visible on your website, you can find out exactly why and fix it. It contains multiple tabs, each helpful for investigating your experiments.
1. Experiments
This tab will show a list of all the experiments running on your website at the moment. It will also tell you if you were included in an experiment or not.
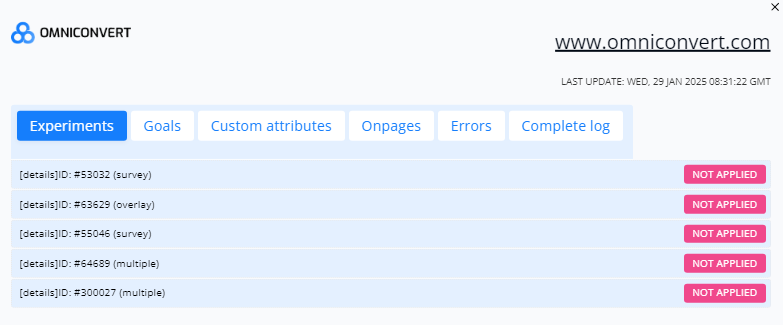
To see why an experiment is not running, click on the experiment id which you want to investigate.

This will expand the experiment and show you why the experiment did not apply.
Possible messages can be:
- Exclusivity – Previously seen an exclusive experiment. You have been included (seen) another experiment that is set as exclusive (check exclusivity options for your running experiments).
- Respondents limit – Number of visitors/respondents already reached. The limit of users included in this experiment has been reached. Check out the limit under ‘Audience’ > ‘Advanced settings’.
- Traffic allocation – Not included by traffic allocation. You haven’t been included in this experiment by randomization. Your traffic settings in ‘Traffic Allocation and Goals’ are not set to 100%. Clear cookies and try a few more times or set the blue traffic bar to 100% for testing.
- Device type – Check device typesetting. You’re not using the device type selected in the Audience – Advanced settings.
- Scheduling – Check scheduling setting. You are now in the excluded time zone entered under Scheduling. Change the settings in order to see the experiment.
- Pages involved – This URL is not involved in this experiment. The URL you’re currently on is not targeted by ‘Audience settings’. It might be a discrepancy between the original URL and the one entered into the Audience. Check out this article regarding how to set up the Audience properly.
- Segment – Check segment conditions. You are not part of the segment set for this experiment. Check out Segment settings and add your IP address for testing purposes. Check out this article on how to test your experiments live on your IP address.
- Frequency – Frequency setting was reached. You are not able to see the experiment because you have reached the frequency limit allocated. Check out Audience – Advanced Settings For testing purposes set the frequency to “Every time”.
- Restrictions – Survey not triggered because already responded/clicked respond later or stop asking me.
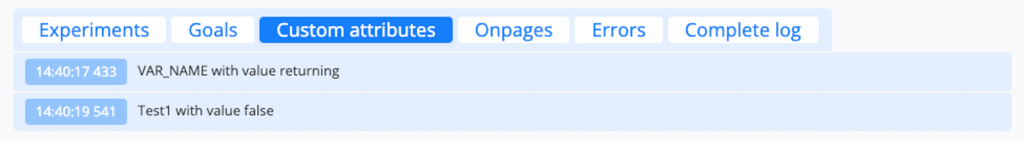
2. Goals
This tab will show you the Goals which have triggered.

3. Custom attributes
This tab will list the Custom attributes which have triggered.
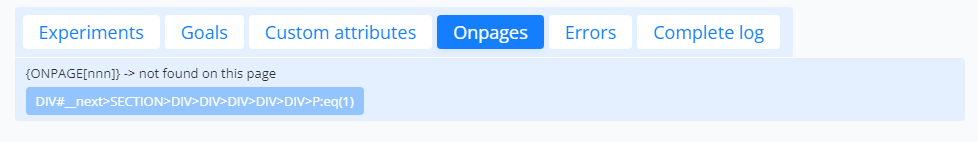
4. On pages
This tab will list the Onpage variables which have triggered.
5. Errors
This tab will list the errors which occurred.

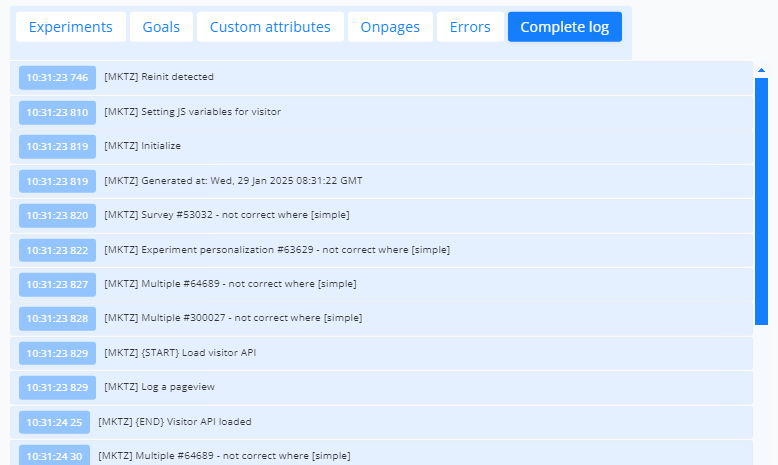
6. Complete log
This tab contains the detailed log for the page.
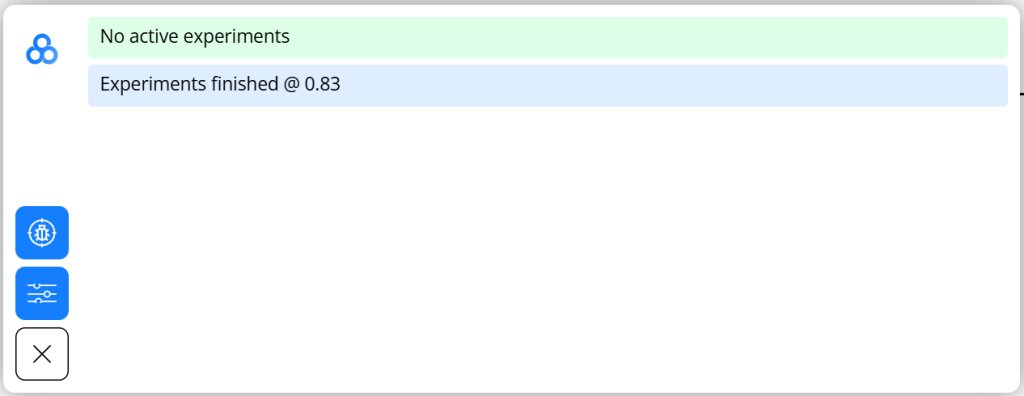
Logger
The Logger is a minimized version of the tool, allowing insights into the logs and the debugger at quick glance.
With the default settings it will only be displayed as a small icon, but pressing on it will expand it.
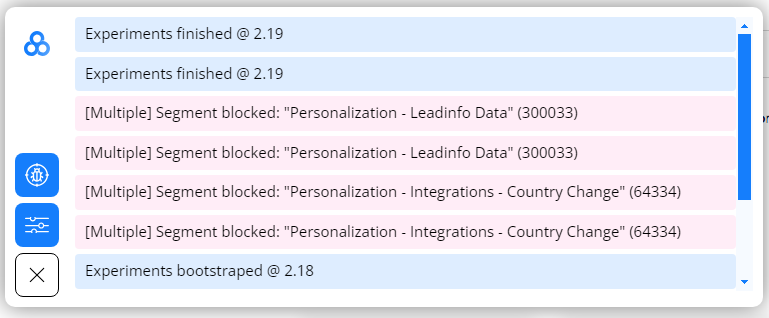
Once you have the Logger expanded, you can see the logs and 2 other options.
1. Open Debugger
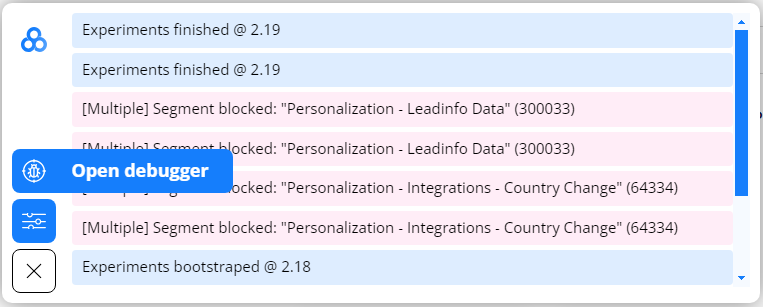
Pressing this button will open the Debugger screen.
2. Show Experiments

Pressing this button will show you the experiments and allow you to change which variation you see.
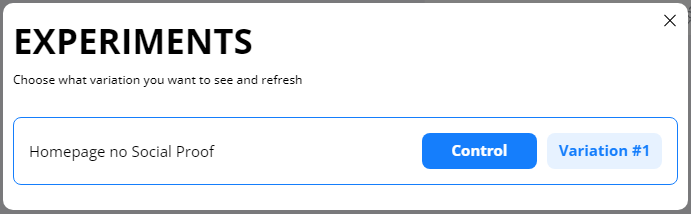
Please bear in mind that this requires a page refresh to apply.