
Tracking Code Not Detected
Overview
If Explore reports that your tracking code isn't detected even though you've installed it, there are two common causes: a Content Security Policy (CSP) on your website blocking the script, or the code waiting on consent that hasn't been given.
Cause 1 - CSP blocking the script
How to identify it
Open your browser's Developer Tools console on the page where the tracking code should be running. If CSP is the cause, you'll see an error similar to:
Refused to load the script 'https://cdn.omniconvert.com/js/[your-id].js'
because it violates the following Content Security Policy directive: "script-src ..."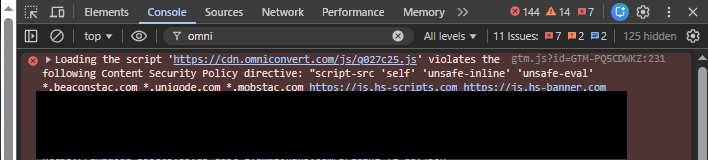
How to fix it
Whitelist Explore's domain in your CSP headers.
The domain must specifically be added to the script-src directive. Adding it only to style-src or font-src (a common mistake) won't fix the issue, since those directives don't govern script loading.
Preferred: add the wildcard *.omniconvert.com.
If a wildcard isn't possible: add both of these explicitly:
-
cdn.omniconvert.com -
app.omniconvert.com
Double-check the domain is entered exactly right. A common typo is a stray trailing asterisk - e.g. *.omniconvert.com* instead of *.omniconvert.com. Also confirm you haven't only whitelisted the bare omniconvert.com without the wildcard or subdomains, which won't cover the actual script URLs.
Cause 2 - Consent not yet given (GDPR)
If your website uses a cookie consent banner, the tracking code may be waiting for the visitor to accept before it runs at all. In this case, you'll see occasional pageviews recorded (from visitors who did accept) but the code won't appear to be reliably active.
Solution: accept the consent banner yourself, then refresh the page before checking again. See Configure GDPR & Privacy Settings for the different ways to control when the tracking code fires relative to consent.
Confirming the fix worked
Once the issue is resolved, verify from a few angles:
-
Browser console - the "Refused to load" error should no longer appear.
-
Explore's tracking code panel - should show the green detection confirmation.
-
Browser extension - with the extension installed, four status options become visible at the bottom of the debugger only when the tracking code is working. The Logger indicator turns blue once the tracking code is confirmed active.
If the error persists after updating the CSP
Browser CSP changes can be affected by caching - both on your server and in the visitor's browser. If your IT team confirms the CSP was updated but the error is still showing:
-
Hard-refresh the page (clearing cache) before checking again.
-
Confirm the change was actually deployed to the live environment, not just a staging one.
-
Check whether other unrelated CSP errors exist on the same page - a website can have multiple scripts blocked simultaneously for different domains, so make sure you're looking at the right one.
Related mistakes worth checking at the same time
If you've just fixed a detection issue, it's a good moment to also verify:
-
Preview requires the tracking code to be working - if previews aren't showing, this is often the same root cause, not a separate bug.
-
Your experiment's Audience - a very common combination of issues is a detection problem plus an Audience condition set to URL is without accounting for UTM parameters or query strings, which silently excludes paid/campaign traffic even after detection is fixed. See Understand How Segmentation Works.
-
Testing on your own IP first - before publishing to real traffic, create a segment based on your own IP address and test there. This is standard best practice regardless of what triggered the original detection issue.